Context
For my second project at IBM, I conducted baseline benchmarking to test a guided tour in Modeler Flows, a drag & drop Machine Learning (ML) tool.
Due to the nature of this project, I have omitted detailed information and am focusing on the process.
Previous research found that it was hard learn Modeler Flows.
Because of this challenge, the Modeler Design team built a Guided Tour that introduced first-time users to the tool by guiding them through the process of building a classification model.
Since the request for research came from the design team, I started by doing stakeholder interviews to learn more about Modeler and the Guided Tour.
After conducting brainstorming sessions with Design and PM, I delivered an official Research Kick-Off presentation that outlined the reasoning behind a benchmark study, the research plan, outstanding questions, and next steps.


Slides from research kick-off presentation that established research objectives and guidelines.
Behavioral Metrics
Metrics
Targets (Industry Standards)
Time on Task
–––>
Task completion
–––>
Unassisted task completion > 100%
Errors
–––>
Errors per task < 3
Assists
–––>
Assists per task < 3
Attitudinal Metrics
Metrics
Targets (Industry Standards)
Single-ease questions (SEQ) - Pre & Post
–––>
SEQ score ≥ 5
System usability scale (SUS)
–––>
SUS score > 66
Errors
–––>
Errors per task < 3
Net promoter score (NPS)
–––>
NPS score > 22
I created a screener targeting data scientists and posted it to 2 recruiting platforms.
Although the study targeted data scientists, I allowed participants with different job titles when they met the required data science skill criteria.
The moderated tests asked participants to complete 2 tasks, a survey, and answer post-task questions.


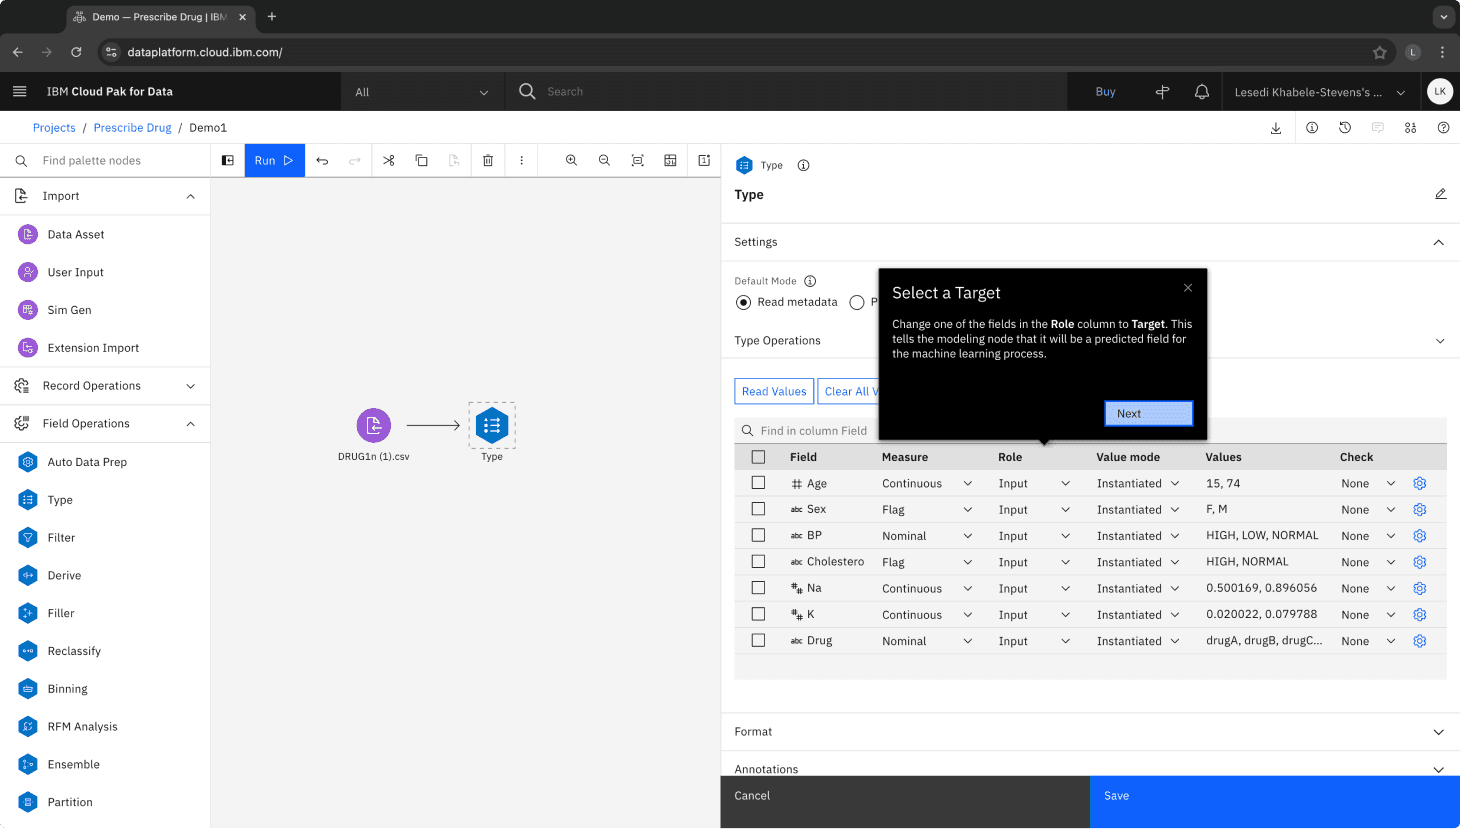
Task 1: Create a New Modeler Flow


Task 2: Build a classification model to predict which drug to give patients
Over two weeks, I synthesized insights and developed a note-taking template.
Initially, I focused on aligning the notes with the recordings to ensure no details were missed. As I filled in gaps, I also organized and affinitized the data in Mural, clustering observations to reveal patterns and key themes.

Virtual whiteboarding to answer research objectives
Because the benchmark study captured both quantitative and qualitative data, I needed a systematic way to track metrics alongside observations. To do this, I created a note-taking template that guided my documentation of each participant’s user path as they completed the tasks, ensuring consistency and enabling clear analysis across sessions.

Note-taking template I created that outlined the Golden Paths to complete Tasks 1 & 2.
The tour helped participants complete tasks more efficiently, though observed attitudes and perceptions were comparable across groups.
Behavioral Metrics
On average, participants using the Tour performed Task 2 at a higher success rate than those without.
Time on Task
Task Completion
Errors
Assists
w/o Tour
18 min.
0%
2
2
w/ Tour
13 min.
25%
6
0.3
Attitudinal Metrics
Although the tour supported task completion, attitudinal feedback indicated it needed improvement to better help new users become familiar with Modeler.
SEQ
SUS
NPS
Issues
w/o Tour
3.3
F
-25
9
w/ Tour
4.6
F
-88
10
Synthesizing usability issues into key themes revealed the critical gaps in the Guided Tour experience.
Using an issue severity matrix, I identified that the workflow violated users’ mental models, resulting in “map shock.” I also found that the Guided Tour’s UI was inconsistent and offered only a surface-level introduction to Modeler Flow. Finally, new users perceived Modeler Flows as a beginner-only tool, despite being designed for users of all skill levels.

5 Issue Themes
I presented the findings and 7 recommendations to my cross-functional partners.
First-time use improvements
Consider looking at the workflow of other IBM products
Work with content designers to craft more user-friendly descriptions for Type node
Update Guided Tour UI
Update Guided Tour UI to consistently use Next or X buttons on all tour pop-ups
Update Guided Tour panel UI to number steps in tour
Update tour options and complexity
Multiple tours based on experience level
After tour: Provide documentation & extra resources
Consider end-to-end integrated tour across Watson Studio
I ran a follow up unmoderated A/B usability study to solve the problems around type node understanding.
The study’s insights led to the implementation of two new features, enhancing new users’ comprehension of the type node, an essential part of Modeler’s workflow.
Behavioral Note-taking Template
The most tedious part of this research was note-taking and mapping every user’s exact path to complete the task. I wish I had created the note-taking template sooner in the process, but it was all part of my journey to completing my first official user research project.
Qualitative Research
I spent a lot of time with the qualitative data, even though I decided not share it with my cross-functional partners. It was challenging to try to learn R Studio, but I had a lot of fun.
" width="16.394736842105267px"><path d="M 0 0 L 15.5 0" fill="transparent" height="1px" id="KUXTs4_nB" stroke-dasharray="0" stroke-linecap="round" stroke-linejoin="miter" stroke-miterlimit="4" stroke-width="1" stroke="rgb(94, 94, 94)" transform="translate(0 7)" width="15.5px"/><path d="M 0 0 L 7 7 L 0 14" fill="transparent" height="14px" id="zsb_KSZIt" stroke-dasharray="0" stroke-linecap="round" stroke-linejoin="round" stroke-width="1" stroke="rgb(94, 94, 94)" transform="translate(9.395 0)" width="7.0000000000000036px"/></g></svg>)